Analysis of US Container Port Volumes in the First Half of 2025
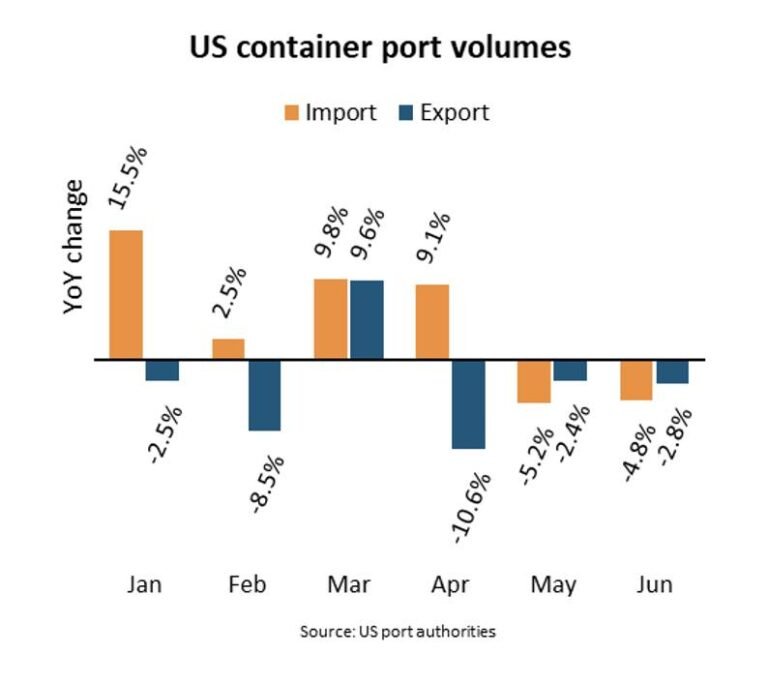
According to Niels Rasmussen, Chief Shipping Analyst at BIMCO, volumes at the nine largest US container ports grew by 1.7% year-over-year to 16.9 million TEU during the first half of 2025. Import volumes saw a significant increase of 4.3%, driven by preloading in anticipation of tariff increases. In contrast, export volumes experienced a decline of 4.2%.
The Budget Lab at Yale reported that the effective US tariff rate fluctuated throughout the first half of 2025. Starting at 2.4% in January, the tariff rate rose to 3.7% in February, 8.9% in March, and peaked at 26.0% in April following the “Liberation Day” announcement. Subsequent reductions and delays brought the tariff rate down to 21.1% in May and 15.7% in June.
Rasmussen noted that the growth in import volumes during the first half of the year was influenced by changes in tariff rates. Some importers utilized bonded and free zone warehouses to avoid higher tariffs, leading to a 10.0% year-over-year increase in import volumes in the first four months. However, import volumes declined by 6.2% in May and June.
US West Coast ports experienced the most significant impact of the volume fluctuations, with a 14.4% increase in import volumes in the first four months followed by a 9.2% decline in May and June. Despite the gains in the first half of 2025, total import volumes remained below the peak levels seen during the COVID pandemic in 2021 and 2022.
On the export side, only China and Canada implemented tariffs in response to US actions, leading to a 4.2% decrease in export volumes from the nine largest US container ports in the first half of the year. This decline is part of a larger trend, as export volumes have been falling since 2018, with only a brief increase of 7.4% in the first half of 2024. Export volumes in the first half of 2025 were 12.5% lower than in 2018.
Rasmussen highlighted that despite some new trade agreements, the average effective US tariff rate stood at 17.6% on August 1st, higher than the rate in June when imports fell by 5.8% year-over-year. Additionally, average spot freight rates from Shanghai to the US dropped over 60% since early June, indicating potential weakness in imports during the third quarter and beyond.
Overall, the analysis of US container port volumes in the first half of 2025 provides insights into the impact of tariff changes and trade dynamics on import and export volumes, signaling potential challenges and opportunities for the rest of the year.

